Florida Storm Data: Hail & Wind History Since 2010
Deduplicated storm activity for Florida, fused from NWS warnings, storm reports, official records, and FEMA declarations.
Latest Florida hail and wind storms
- Last reported hail in Florida (0.75 in.+, screening): October 23, 2026 — 1.75 in. reported at 2 NE Riviera Beach (Palm Beach County), SPC storm report.
- 2026 so far in Florida: 30 hail days and 120 wind days statewide (days with a storm report or station gust at the screening thresholds; warnings alone never count).
| Date | Largest reported hail | Strongest gust | City pages hit |
|---|---|---|---|
| October 28, 2026 | — | 77 mph measured | Fort Walton Beach |
| October 25, 2026 | — | 50 mph measured | Palm Coast, Jacksonville Beach |
| October 24, 2026 | — | 63 mph measured | Jacksonville, Port St. Lucie, Palm Coast, Jacksonville Beach, Fort Pierce +2 more |
| October 23, 2026 | 1.75 in. reported | — | West Palm Beach, Boynton Beach, Jupiter, Palm Beach Gardens, Wellington +1 more |
| October 22, 2026 | — | 71 mph measured | Tampa, St. Petersburg, Clearwater, Largo, Pinellas Park +3 more |
| October 18, 2026 | — | 46 mph reported | Palm Coast, Jacksonville Beach |
| October 17, 2026 | — | 46 mph measured | Panama City |
| October 16, 2026 | — | 83 mph measured | — |
| October 12, 2026 | — | 82 mph measured | Deltona, Daytona Beach, Sanford, Port Orange, DeLand |
| October 10, 2026 | — | 45 mph measured | Jacksonville, Jacksonville Beach |
Florida storm facts
- StormAuditor's analysis of NOAA and National Weather Service records found 5,269 deduplicated storm events (wind, hail, tornado, and flood; NWS warning products included) in Florida in the 12 months ending November 16, 2026.
- Storm activity touched 67 of 67 Florida counties over that period.
- The most impacted county in Florida was Duval, with 167 events.
- The busiest day by event count in Florida was March 16, 2026, with 155 events.
Florida storm activity at a glance (last 12 months)
StormAuditor's consolidated public record currently shows 5,269 storm events impacting 67 of Florida's 67 counties in the trailing 12 months: 3,475 wind events, 1,139 hail events, 79 tornado events, 576 flood events. Every count includes NWS warnings as well as observed reports, so tornado events mean tornado warnings and reports, not confirmed tornadoes.
Events are fused from National Weather Service warnings and Special Weather Statements, observed Local Storm Reports, official NCEI storm records, and FEMA disaster declarations, then consolidated into a single event table under the published methodology.
Wind covers thunderstorm and non-thunderstorm wind alike, so these counts measure something different from the NCEI entry counts in the history section below; the two are not comparable year to year. State totals also count NWS Special Weather Statements (radar-indicated hail or gusts below warning level); city pages leave those out.
Busiest days in Florida by event count
Ranked by the number of 12-month events, NWS warnings included, so a day with many warnings can outrank a day with larger hail.
- March 16, 2026 — 155 events incl. warnings (hail, tornado, wind)
- October 9, 2026 — 143 events incl. warnings (flood, hail, tornado, wind)
- August 19, 2026 — 108 events incl. warnings (flood, hail, wind)
- July 10, 2026 — 104 events incl. warnings (hail, tornado, wind)
- July 30, 2026 — 94 events incl. warnings (flood, hail, wind)
Most impacted counties
Events of every type for each county — wind, hail, tornado and flood, NWS warnings and Special Weather Statements included. City pages count wind and hail events only, so a county number on a city page is never higher than the number here.
- Duval — 167 events
- Brevard — 161 events
- Leon — 157 events
- Bay — 149 events
- Walton — 149 events
- Nassau — 125 events
- Washington — 124 events
- Marion — 123 events
Additional activity recorded under other NWS area names (forecast zones, tribal lands, and former census areas): Trout River (5) · Monroe Upper Keys (4) · Brevard Barrier Islands (3) · Mainland Monroe (2).
How these numbers are counted
The storm numbers on this page are counted in four different ways, plus the free address check. Each answers a different question with its own size cutoffs, area and time span, so compare numbers within one group, not across groups.
- Storm days (latest hail and wind): A day in the last 12 months when at least one report anywhere in Florida showed hail 0.75 in. or larger or wind of 45 mph or more (StormAuditor screening thresholds). Reports are NWS storm reports from spotters, the public and officials, plus weather-station gusts, which count from 50 mph. A warning on its own never makes a storm day. The "City pages hit" column and each city's last reported hail apply the same rule within 25 miles of the city. The statewide columns count reports inside Florida only. City pages count reports within 25 miles of each city, which can reach into a neighboring state; those values name the other state, so a border city's value for a day can be higher than the Florida value.
- Storm-date pages (NWS severe): A storm-date page is published only when at least one report or station gust within 25 miles of a city met the National Weather Service severe criteria (hail 1.00 in. or larger, or wind 58 mph or more), at least two separate observations were logged, and the day ranks among the most significant. A storm report that relays an airport weather station's reading (the same station, the same gust and the same time) counts once, as the station reading. Not every storm day gets a page; when one does, the page and the storm-day table show the same largest hail and strongest gust.
- Events (12-month counts): Events count the Florida storm log: NWS warnings and Special Weather Statements (a lower-level NWS alert), storm reports (wind 50 mph+, hail 0.75 in.+), station gusts, NCEI entries and FEMA disaster declarations, for each county affected, floods included. One event is one place on one day, counted separately for each type (wind, hail, tornado, flood). A weather station or storm-report point counts once a day, at that day's highest reading, however many readings it filed; a place with hail and wind on the same day is two events. NWS warnings and Special Weather Statements count once per county per day, and NCEI entries and FEMA declarations once per place per day. A storm report that relays an airport weather station's reading (the same station, the same gust and the same time) counts once, as the station reading. The same report arriving through another feed (SPC or NCEI) is one record. The most impacted counties list uses this count. City pages count only wind and hail within 25 miles and leave out floods and Special Weather Statements, so city counts do not add up to the state total, and a city page's county count is a wind-and-hail count that is never higher than the same county's number here.
- NOAA history (since 2010): The official NOAA storm record (NCEI Storm Events) in Florida from January 1, 2010 to the day before the 12-month window starts: hail 0.50 in.+, thunderstorm wind 40 mph+ and tornadoes. It is a separate, older record with its own "storm days" (days with any entry), so its counts are not compared with the 12-month numbers.
- Free Report Snapshot: A free YES/NO estimate for one address, from radar and wind analysis at the property rather than area reports, at the same screening thresholds: hail 0.75 in. or wind 45 mph.
Full method: Methodology and Data Sources.
Florida hail and wind history in NOAA NCEI records, 2010–Nov. 2025
This section covers January 1, 2010 through November 15, 2025. Storms from November 16, 2025 on are in the 12-month summary above, so no date is counted in both.
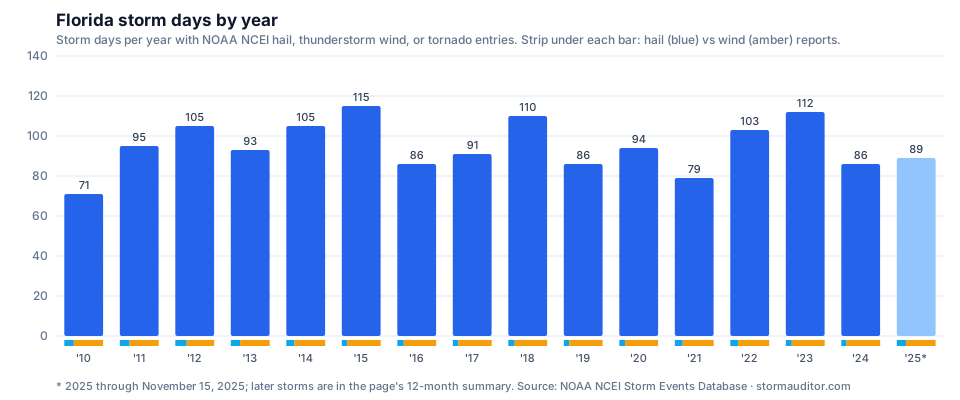
The National Centers for Environmental Information logged 1,520 storm days in Florida in this period — 11,767 NCEI Storm Events entries in all. Thunderstorm wind outnumbers hail about 4.3 to 1 here: 8,816 wind reports against 2,030 hail reports.
The most storm days came in 2015, with 115; the fewest in a full year was 71, in 2010. Across 2022–2024, Florida averaged 100 storm days a year, above the 15-year average of 95.
The largest hail in these records for Florida was 3.00 in. (teacup size), reported in 4 different years — most recently on April 26, 2023 in Marion County. Hail of 2 inches or more appears in 13 different years of this record, the latest being 2025 through Nov. 15. The strongest measured thunderstorm gust was 97 mph on June 10, 2015 in Brevard County. NCEI also lists 921 tornado entries in Florida — one entry per county a tornado crossed.
Hail peaks in May (25% of all hail reports), while thunderstorm wind reports cluster in June. December through February accounts for 135 storm days.
- Average: 95 storm days a year (2010–2024)
- April and May: 48% of all hail reports
- Most hail reports in one year: 258 in 2023
- Hail of 1 in. or larger reported in every full year, 2010–2024
| Year | Hail reports | Thunderstorm wind reports | Tornado entries | Storm days | Largest hail | Strongest measured gust |
|---|---|---|---|---|---|---|
| 2010 | 82 | 253 | 21 | 71 | 1.75 in. | 74 mph |
| 2011 | 192 | 566 | 39 | 95 | 2.50 in. | 86 mph |
| 2012 | 187 | 448 | 48 | 105 | 3.00 in. | 78 mph |
| 2013 | 103 | 328 | 38 | 93 | 2.75 in. | 91 mph |
| 2014 | 139 | 525 | 30 | 105 | 1.75 in. | 79 mph |
| 2015 | 112 | 695 | 30 | 115 | 1.75 in. | 97 mph |
| 2016 | 91 | 453 | 45 | 86 | 2.00 in. | 84 mph |
| 2017 | 76 | 461 | 57 | 91 | 2.75 in. | 71 mph |
| 2018 | 85 | 431 | 46 | 110 | 3.00 in. | 74 mph |
| 2019 | 73 | 442 | 29 | 86 | 2.00 in. | 69 mph |
| 2020 | 99 | 563 | 64 | 94 | 3.00 in. | 78 mph |
| 2021 | 156 | 616 | 66 | 79 | 2.00 in. | 85 mph |
| 2022 | 218 | 868 | 142 | 103 | 2.00 in. | 82 mph |
| 2023 | 258 | 1,426 | 106 | 112 | 3.00 in. | 85 mph |
| 2024 | 75 | 475 | 132 | 86 | 2.00 in. | 87 mph |
| 2025 through Nov. 15 | 84 | 266 | 28 | 89 | 2.50 in. | 70 mph |
Counties with the most NCEI storm reports, 2010–Nov. 2025
| County | All entries | Hail | Thunderstorm wind |
|---|---|---|---|
| Leon County | 886 | 53 | 812 |
| Duval County | 644 | 118 | 510 |
| Jackson County | 387 | 21 | 347 |
| Wakulla County | 371 | 13 | 341 |
| Brevard County | 367 | 98 | 238 |
| Walton County | 355 | 27 | 289 |
| Alachua County | 353 | 66 | 282 |
| Marion County | 345 | 44 | 291 |
| Bay County | 341 | 43 | 263 |
| Palm Beach County | 328 | 99 | 169 |
Download this history: CSV · JSON at https://www.stormauditor.com/downloads/storm-history/fl.json (free, open license, cite StormAuditor).
Source: NOAA NCEI Storm Events Database (thunderstorm wind, hail, and tornado entries; hail 0.50 in. or larger, wind 40 mph or more; wind converted from knots).
Florida storm history questions, 2010–Nov. 2025
How big did hail get in Florida, 2010–Nov. 2025?
3.00 in., teacup size, reported in 4 different years; most recently on April 26, 2023 in Marion County, per NCEI. Hail of 2 inches or more appears in 13 years of this record in all, most recently 2022, 2024 and 2025 through Nov. 15.
Which year had the most storm days in Florida, 2010–Nov. 2025?
2015, with 115 storm days (112 hail reports, 695 thunderstorm wind reports, 30 tornado entries). The 15-year average is 95 storm days.
How many hail reports does Florida see in a typical year?
About 130 hail reports a year (2010–2024 average), with 1-inch or larger hail reported every year. Thunderstorm wind averages 570 reports a year.
What month has the most hail in Florida?
May has the most hail reports (502, 2010–Nov. 2025), followed by April (469) and June (395).
What is the strongest measured thunderstorm gust in Florida, 2010–Nov. 2025?
97 mph, measured on June 10, 2015 in Brevard County. Only gusts NCEI lists as measured count here; gusts measured on a date and county with a tornado entry, and entries of 120 knots or more (known entry errors), are left out.
Working storm claims? Roofing contractors, public adjusters, and insurance adjusters work from this same public storm record with statewide hail and wind maps and per-address reports — see StormAuditor for professionals.
Sources: NWS alerts (api.weather.gov) · NWS Local Storm Reports via the Iowa Environmental Mesonet · ASOS/AWOS station gusts via the Iowa Environmental Mesonet · NOAA NCEI Storm Events Database · every StormAuditor data source.
Download the Florida dataset (free)
The full consolidated Florida event list for the trailing 12 months — dates, counties, hazard types, severities, measured gusts and hail sizes, with coordinates; source records deduplicated, and each NWS warning product listed per affected county — downloads free and stays current with the live record: download CSV · JSON at https://www.stormauditor.com/downloads/storm-data/fl.json. Free to reuse under the data license; the JSON file carries a field dictionary and provenance notes.
Research a specific Florida address
Statewide counts tell you where activity concentrated; they do not tell you what happened at one property. For an individual address:
- Run the Free Report Snapshot — an instant YES/NO against StormAuditor's screening thresholds (wind ≥ 45 mph, hail ≥ 0.75 in., deliberately below the official NWS severe criteria).
- Use the Address Lookup for warnings, storm reports, and station observations at the address.
- Buy a full Weather Report for $2.99 covering every qualifying storm date at the address.
Browse day-by-day activity on the Storm Calendar (Pro plans and higher) or compare states on the Storm Data hub.
All values are derived from public NOAA and NWS data under StormAuditor's published methodology (see Limitations). Data last refreshed November 16, 2026.
See where recent storms tracked on the statewide Florida hail map and wind map (the Hail and Wind Explorers, included with Pro+ and Organization plans), or check the county impact heatmap (free with an account).
Florida cities A–Z: last reported hail
- Altamonte Springs hail & wind history — last hail August 26, 2026 (0.88 in. reported)
- Apopka hail & wind history — last hail August 26, 2026 (0.88 in. reported)
- Boca Raton hail & wind history — last hail August 26, 2026 (0.88 in. reported)
- Bonita Springs hail & wind history — no 0.75 in.+ hail reported within 25 miles in 12 months
- Boynton Beach hail & wind history — last hail October 23, 2026 (1.75 in. reported)
- Bradenton hail & wind history — last hail June 27, 2026 (0.88 in. reported)
- Brandon hail & wind history — last hail July 10, 2026 (1.00 in. reported)
- Cape Coral hail & wind history — no 0.75 in.+ hail reported within 25 miles in 12 months
- Clearwater hail & wind history — no 0.75 in.+ hail reported within 25 miles in 12 months
- Clermont hail & wind history — last hail August 26, 2026 (0.88 in. reported)
- Coconut Creek hail & wind history — last hail August 26, 2026 (0.88 in. reported)
- Coral Gables hail & wind history — last hail July 2, 2026 (0.75 in. reported)
- Coral Springs hail & wind history — last hail August 26, 2026 (0.88 in. reported)
- Davie hail & wind history — last hail August 26, 2026 (0.88 in. reported)
- Daytona Beach hail & wind history — last hail June 18, 2026 (0.75 in. reported)
- Deerfield Beach hail & wind history — last hail August 26, 2026 (0.88 in. reported)
- DeLand hail & wind history — last hail June 18, 2026 (0.75 in. reported)
- Delray Beach hail & wind history — last hail October 23, 2026 (1.75 in. reported)
- Deltona hail & wind history — last hail June 2, 2026 (1.00 in. reported)
- Doral hail & wind history — last hail July 2, 2026 (0.75 in. reported)
- Fort Lauderdale hail & wind history — last hail August 26, 2026 (0.88 in. reported)
- Fort Myers hail & wind history — no 0.75 in.+ hail reported within 25 miles in 12 months
- Fort Pierce hail & wind history — last hail February 28, 2026 (1.00 in. reported)
- Fort Walton Beach hail & wind history — no 0.75 in.+ hail reported within 25 miles in 12 months
- Gainesville hail & wind history — last hail July 11, 2026 (0.75 in. reported)
- Hialeah hail & wind history — last hail July 2, 2026 (0.75 in. reported)
- Hollywood hail & wind history — last hail August 26, 2026 (0.88 in. reported)
- Homestead hail & wind history — no 0.75 in.+ hail reported within 25 miles in 12 months
- Jacksonville hail & wind history — last hail July 11, 2026 (0.75 in. reported)
- Jacksonville Beach hail & wind history — no 0.75 in.+ hail reported within 25 miles in 12 months
- Jupiter hail & wind history — last hail October 23, 2026 (1.75 in. reported)
- Key West hail & wind history — no 0.75 in.+ hail reported within 25 miles in 12 months
- Kissimmee hail & wind history — last hail August 26, 2026 (0.88 in. reported)
- Lakeland hail & wind history — last hail May 2, 2026 (0.75 in. reported)
- Largo hail & wind history — no 0.75 in.+ hail reported within 25 miles in 12 months
- Lauderhill hail & wind history — last hail August 26, 2026 (0.88 in. reported)
- Lehigh Acres hail & wind history — no 0.75 in.+ hail reported within 25 miles in 12 months
- Melbourne hail & wind history — last hail June 23, 2026 (0.75 in. reported)
- Miami hail & wind history — last hail July 2, 2026 (0.75 in. reported)
- Miami Beach hail & wind history — last hail July 2, 2026 (0.75 in. reported)
- Miami Gardens hail & wind history — last hail July 2, 2026 (0.75 in. reported)
- Miramar hail & wind history — last hail July 2, 2026 (0.75 in. reported)
- Naples hail & wind history — no 0.75 in.+ hail reported within 25 miles in 12 months
- New Port Richey hail & wind history — last hail July 10, 2026 (1.00 in. reported)
- North Miami hail & wind history — last hail July 2, 2026 (0.75 in. reported)
- North Port hail & wind history — no 0.75 in.+ hail reported within 25 miles in 12 months
- Ocala hail & wind history — no 0.75 in.+ hail reported within 25 miles in 12 months
- Ocoee hail & wind history — last hail August 26, 2026 (0.88 in. reported)
- Orlando hail & wind history — last hail August 26, 2026 (0.88 in. reported)
- Oviedo hail & wind history — last hail May 12, 2026 (1.00 in. reported)
- Palm Bay hail & wind history — last hail June 23, 2026 (0.75 in. reported)
- Palm Beach Gardens hail & wind history — last hail October 23, 2026 (1.75 in. reported)
- Palm Coast hail & wind history — last hail June 18, 2026 (0.75 in. reported)
- Panama City hail & wind history — last hail August 19, 2026 (0.88 in. reported)
- Pembroke Pines hail & wind history — last hail July 2, 2026 (0.75 in. reported)
- Pensacola hail & wind history — last hail March 16, 2026 (1.00 in. reported)
- Pinellas Park hail & wind history — last hail March 15, 2026 (0.75 in. reported)
- Plant City hail & wind history — last hail July 10, 2026 (1.00 in. reported)
- Plantation hail & wind history — last hail August 26, 2026 (0.88 in. reported)
- Pompano Beach hail & wind history — last hail August 26, 2026 (0.88 in. reported)
- Port Orange hail & wind history — last hail June 18, 2026 (0.75 in. reported)
- Port St. Lucie hail & wind history — last hail February 28, 2026 (1.00 in. reported)
- Riverview hail & wind history — last hail June 27, 2026 (0.88 in. reported)
- Sanford hail & wind history — last hail June 2, 2026 (1.00 in. reported)
- Sarasota hail & wind history — last hail March 25, 2026 (0.88 in. reported)
- Spring Hill hail & wind history — last hail July 17, 2026 (1.00 in. reported)
- St. Cloud hail & wind history — no 0.75 in.+ hail reported within 25 miles in 12 months
- St. Petersburg hail & wind history — last hail June 27, 2026 (0.88 in. reported)
- Stuart hail & wind history — last hail July 12, 2026 (0.88 in. reported)
- Sunrise hail & wind history — last hail August 26, 2026 (0.88 in. reported)
- Tallahassee hail & wind history — last hail July 5, 2026 (0.75 in. reported)
- Tamarac hail & wind history — last hail August 26, 2026 (0.88 in. reported)
- Tampa hail & wind history — last hail July 10, 2026 (1.00 in. reported)
- Titusville hail & wind history — last hail May 12, 2026 (1.00 in. reported)
- Venice hail & wind history — no 0.75 in.+ hail reported within 25 miles in 12 months
- Vero Beach hail & wind history — last hail March 15, 2026 (1.75 in. reported)
- Wellington hail & wind history — last hail October 23, 2026 (1.75 in. reported)
- Wesley Chapel hail & wind history — last hail July 17, 2026 (1.00 in. reported)
- West Palm Beach hail & wind history — last hail October 23, 2026 (1.75 in. reported)
- Weston hail & wind history — last hail August 26, 2026 (0.88 in. reported)
- Winter Garden hail & wind history — last hail August 26, 2026 (0.88 in. reported)
- Winter Haven hail & wind history — no 0.75 in.+ hail reported within 25 miles in 12 months
- Winter Park hail & wind history — last hail August 26, 2026 (0.88 in. reported)
- Winter Springs hail & wind history — last hail August 26, 2026 (0.88 in. reported)
Neighboring states: Alabama storm data · Georgia storm data
Guides for reading this data
Storm-day records in Florida
The newest storm-date pages for Florida cities: a report or station gust within 25 miles of the city met NWS severe criteria (hail 1.00 in.+ or wind 58 mph+), with at least two separate observations. Each page lists the reports, station gusts and a free way to check one address:
Cite or link to this data — free
Free to quote, summarize, reuse, and link — for bloggers, journalists, researchers, contractors, and AI writing tools. No permission or credit required. A ready-made citation and link are below if they help. Terms: StormAuditor data & content license.
Citation: StormAuditor. "Florida Storm Data: Hail & Wind History Since 2010." Updated November 11, 2026. https://www.stormauditor.com/storm-data/fl
HTML link: <a href="https://www.stormauditor.com/storm-data/fl">Florida Storm Data: Hail & Wind History Since 2010 — StormAuditor</a>
About this page: built by Storm Auditor LLC from public NOAA/NWS records — deduplicated warnings, storm reports, station measurements, and official records on a rolling 12-month window, under the published methodology. See the StormAuditor Editorial Team for how content is produced.
Read more: Recent Major Storm Days in Florida: History & Research